# Remember to load the wine dataset again if you need to
from sklearn.datasets import load_wine
wine_data = load_wine()
X = wine_data.data
y = wine_data.target
feature_names = wine_data.feature_names
target_names = wine_data.target_names

import numpy as np
# Add noise: Gaussian noise (mean=0, std=feature_std * noise_factor)
noise_factor = 0.3
rng = np.random.RandomState(42)
X_noisy = X + noise_factor * rng.normal(size=X.shape)

# Add irrelevant random features
random_features = rng.normal(size=(X.shape[0], 5))  # add 5 random features
X_noisy = np.hstack([X, random_features])


from sklearn.model_selection import train_test_split
# Split into train and test sets
X_train, X_test, y_train, y_test = train_test_split(X_noisy, y, test_size=0.2, random_state=42)What is a Random Forest?
What is Random Forest?
A Random Forest is an ensemble method that builds many Decision Trees and combines their results to make more accurate and stable predictions.
Independent Decision Trees:
Each tree in a Random Forest is trained independently with the following process:
Random Data Subset : Each tree is trained on a random subset of the training data — this is known as Bootstrap Aggregating (or Bagging).
Random Feature Subset: When creating splits in each tree, only a random subset of features is considered for each split. This adds further diversity to the trees.
No explicit depth control: By default, Random Forest doesn’t limit the depth of each tree. Therefore, trees will grow to their natural depth based on the data they’re given.
Voting for prediction
Since each tree is grown independently and the final prediction is made by aggregating (voting or averaging) the results of all the trees, the overall ensemble effect reduces overfitting:
Even if one or two trees are overfitted (i.e., they grow too deep), the ensemble average (or majority vote) will smooth out their influence on the final prediction. This is why Random Forests are more robust to overfitting compared to a single decision tree, which can easily memorize the training data if grown too deep.
Example
from sklearn.ensemble import RandomForestClassifier
from sklearn.metrics import accuracy_score

# Train Random Forest on the noisy dataset
rf_clf = RandomForestClassifier(n_estimators=100, max_depth=None, random_state=30)
rf_clf.fit(X_train, y_train)

# Predict on training and testing data
rf_train_pred = rf_clf.predict(X_train)
rf_test_pred = rf_clf.predict(X_test)

# Accuracy scores
rf_train_acc = accuracy_score(y_train, rf_train_pred)
rf_test_acc = accuracy_score(y_test, rf_test_pred)

print(f"Random Forest Training Accuracy: {rf_train_acc:.2f}")
print(f"Random Forest Testing Accuracy: {rf_test_acc:.2f}")
Random Forest Training Accuracy: 1.00
Random Forest Testing Accuracy: 1.00## NB This block of code repeats the DecisionTreeClassifier
## we did before, you don't need to run it again if
## you are using the same notebook
from sklearn.tree import DecisionTreeClassifier
from sklearn.metrics import accuracy_score
# Train Decision Trees with different depths and record accuracy
max_depth_range = range(1, 10)
train_accuracies = []
test_accuracies = []
for depth in max_depth_range:
clf = DecisionTreeClassifier(max_depth=depth, random_state=42)
clf.fit(X_train, y_train)
# Predict on training and testing data
train_pred = clf.predict(X_train)
test_pred = clf.predict(X_test)
# Accuracy scores
train_acc = accuracy_score(y_train, train_pred)
test_acc = accuracy_score(y_test, test_pred)
train_accuracies.append(train_acc)
test_accuracies.append(test_acc)import matplotlib.pyplot as plt
# Add Random Forest horizontal lines for comparison
plt.figure(figsize=(8, 5))
plt.plot(max_depth_range, train_accuracies, label='Decision Tree Training Accuracy', marker='o')
plt.plot(max_depth_range, test_accuracies, label='Decision Tree Testing Accuracy', marker='s')
plt.axhline(y=rf_train_acc, color='green', linestyle='dashed', label='Random Forest Training Accuracy')
plt.axhline(y=rf_test_acc, color='orange', linestyle='dashdot', label='Random Forest Testing Accuracy')
plt.xlabel('Max Depth of Decision Tree')
plt.ylabel('Accuracy')
plt.title('Decision Tree vs Random Forest Accuracy')
plt.legend()
plt.grid(True)
plt.show()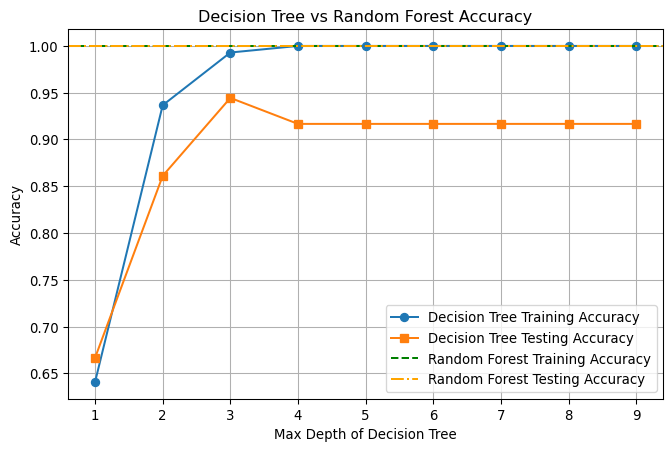
importances = rf_clf.feature_importances_
indices = np.argsort(importances)[::-1]
feature_names = list(feature_names) + [f'Random{i}' for i in range(1, 6)]

plt.figure(figsize=(12, 6))
plt.title("Feature Importances from Random Forest")
plt.bar(range(len(importances)), importances[indices], align="center")
plt.xticks(range(len(importances)), [feature_names[i] for i in indices], rotation=90)
plt.tight_layout()
plt.show()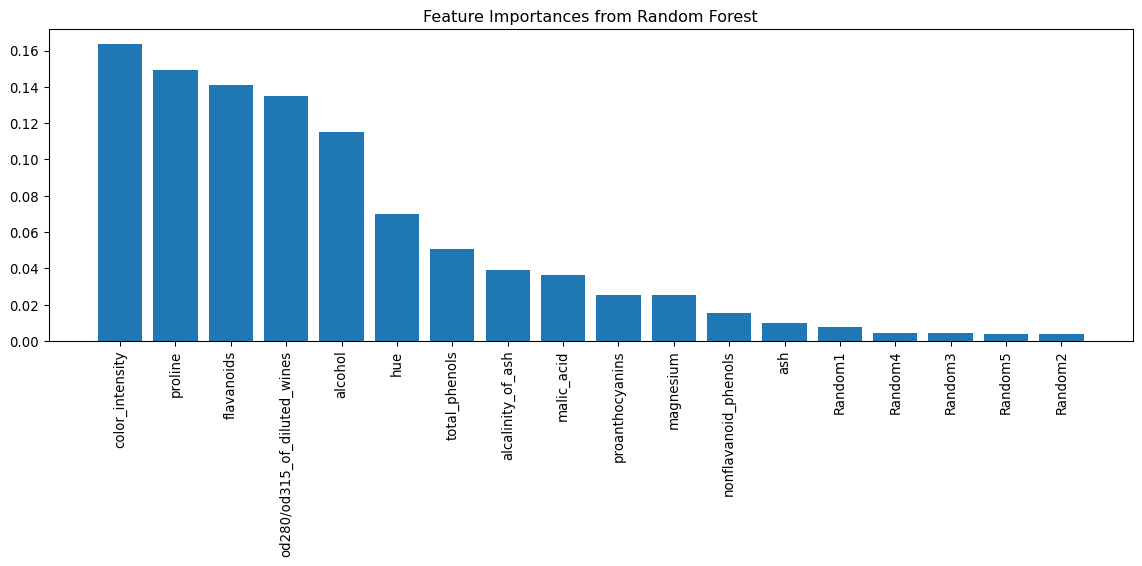
Further information about feature importance in scikit-learn https://scikit-learn.org/stable/auto_examples/ensemble/plot_forest_importances.html.