import pandas as pdFirstly, if we read the data in without passing any extra arguments, we get:
temperature = pd.read_csv(
    "./data/meantemp_monthly_totals.txt",
)
temperature.head()| Mean Central England Temperature (Degrees Celsius) | |
|---|---|
| 1659-1973 Manley (Q.J.R.METEOROL.SOC. | 1974) |
| 1974 on Parker et al. (INT.J.CLIM. | 1992) |
| Parker and Horton (INT.J.CLIM. | 2005) |
| Year Jan Feb Mar Apr May Jun Jul Aug Sep Oct Nov Dec Annual | NaN |
| 1659 3.0 4.0 6.0 7.0 11.0 13.0 16.0 16.0 13.0 10.0 5.0 2.0 8.9 | NaN |
So we need to dot he same as before, setting the skiprows argument:
temperature = pd.read_csv(
    "./data/meantemp_monthly_totals.txt",
    skiprows=4,  # skip first 4 rows of the header
)
temperature.head()| Year Jan Feb Mar Apr May Jun Jul Aug Sep Oct Nov Dec Annual | |
|---|---|
| 0 | 1659 3.0 4.0 6.0 7.0 11.0 13... |
| 1 | 1660 0.0 4.0 6.0 9.0 11.0 14... |
| 2 | 1661 5.0 5.0 6.0 8.0 11.0 14... |
| 3 | 1662 5.0 6.0 6.0 8.0 11.0 15... |
| 4 | 1663 1.0 1.0 5.0 7.0 10.0 14... |
It’s not separating the columns correctly so if we look at the data and see spaces, we might think that useing sep=" " would work, but if we try it:
temperature = pd.read_csv(
    "./data/meantemp_monthly_totals.txt",
    skiprows=4,
    sep=" ",  # try this...
)
temperature.head()| Unnamed: 0 | Unnamed: 1 | Year | Unnamed: 3 | Unnamed: 4 | Unnamed: 5 | Jan | Unnamed: 7 | Unnamed: 8 | Unnamed: 9 | ... | Unnamed: 43 | Unnamed: 44 | Unnamed: 45 | Nov | Unnamed: 47 | Unnamed: 48 | Unnamed: 49 | Dec | Unnamed: 51 | Annual | |
|---|---|---|---|---|---|---|---|---|---|---|---|---|---|---|---|---|---|---|---|---|---|
| 0 | NaN | NaN | 1659 | NaN | NaN | NaN | 3.0 | NaN | NaN | NaN | ... | NaN | 2.0 | NaN | NaN | NaN | 8.9 | NaN | NaN | NaN | NaN |
| 1 | NaN | NaN | 1660 | NaN | NaN | NaN | 0.0 | NaN | NaN | NaN | ... | NaN | 5.0 | NaN | NaN | NaN | 9.1 | NaN | NaN | NaN | NaN |
| 2 | NaN | NaN | 1661 | NaN | NaN | NaN | 5.0 | NaN | NaN | NaN | ... | NaN | 6.0 | NaN | NaN | NaN | 9.8 | NaN | NaN | NaN | NaN |
| 3 | NaN | NaN | 1662 | NaN | NaN | NaN | 5.0 | NaN | NaN | NaN | ... | NaN | 3.0 | NaN | NaN | NaN | 9.5 | NaN | NaN | NaN | NaN |
| 4 | NaN | NaN | 1663 | NaN | NaN | NaN | 1.0 | NaN | NaN | NaN | ... | NaN | 5.0 | NaN | NaN | NaN | 8.6 | NaN | NaN | NaN | NaN |
5 rows × 53 columns
That doesn’t look right. This is because sep=" " means “use a single space” as the separator, but in the data most columns are separated by multiple spaces. To make it use “any number of spaces” as the separator, you can instead set sep=r'\s+':
temperature = pd.read_csv(
    "./data/meantemp_monthly_totals.txt",
    skiprows=4,
    sep=r'\s+',  # whitespace-separated columns
)
temperature.head()| Year | Jan | Feb | Mar | Apr | May | Jun | Jul | Aug | Sep | Oct | Nov | Dec | Annual | |
|---|---|---|---|---|---|---|---|---|---|---|---|---|---|---|
| 0 | 1659 | 3.0 | 4.0 | 6.0 | 7.0 | 11.0 | 13.0 | 16.0 | 16.0 | 13.0 | 10.0 | 5.0 | 2.0 | 8.9 |
| 1 | 1660 | 0.0 | 4.0 | 6.0 | 9.0 | 11.0 | 14.0 | 15.0 | 16.0 | 13.0 | 10.0 | 6.0 | 5.0 | 9.1 |
| 2 | 1661 | 5.0 | 5.0 | 6.0 | 8.0 | 11.0 | 14.0 | 15.0 | 15.0 | 13.0 | 11.0 | 8.0 | 6.0 | 9.8 |
| 3 | 1662 | 5.0 | 6.0 | 6.0 | 8.0 | 11.0 | 15.0 | 15.0 | 15.0 | 13.0 | 11.0 | 6.0 | 3.0 | 9.5 |
| 4 | 1663 | 1.0 | 1.0 | 5.0 | 7.0 | 10.0 | 14.0 | 15.0 | 15.0 | 13.0 | 10.0 | 7.0 | 5.0 | 8.6 |
That looks much better! Now we set the index_col:
temperature = pd.read_csv(
    "./data/meantemp_monthly_totals.txt",
    skiprows=4,
    sep=r'\s+',
    index_col="Year",  # Set the index
)
temperature.head()| Jan | Feb | Mar | Apr | May | Jun | Jul | Aug | Sep | Oct | Nov | Dec | Annual | |
|---|---|---|---|---|---|---|---|---|---|---|---|---|---|
| Year | |||||||||||||
| 1659 | 3.0 | 4.0 | 6.0 | 7.0 | 11.0 | 13.0 | 16.0 | 16.0 | 13.0 | 10.0 | 5.0 | 2.0 | 8.9 |
| 1660 | 0.0 | 4.0 | 6.0 | 9.0 | 11.0 | 14.0 | 15.0 | 16.0 | 13.0 | 10.0 | 6.0 | 5.0 | 9.1 |
| 1661 | 5.0 | 5.0 | 6.0 | 8.0 | 11.0 | 14.0 | 15.0 | 15.0 | 13.0 | 11.0 | 8.0 | 6.0 | 9.8 |
| 1662 | 5.0 | 6.0 | 6.0 | 8.0 | 11.0 | 15.0 | 15.0 | 15.0 | 13.0 | 11.0 | 6.0 | 3.0 | 9.5 |
| 1663 | 1.0 | 1.0 | 5.0 | 7.0 | 10.0 | 14.0 | 15.0 | 15.0 | 13.0 | 10.0 | 7.0 | 5.0 | 8.6 |
And, as we should always do, we plot the data we’ve just read in:
temperature.plot()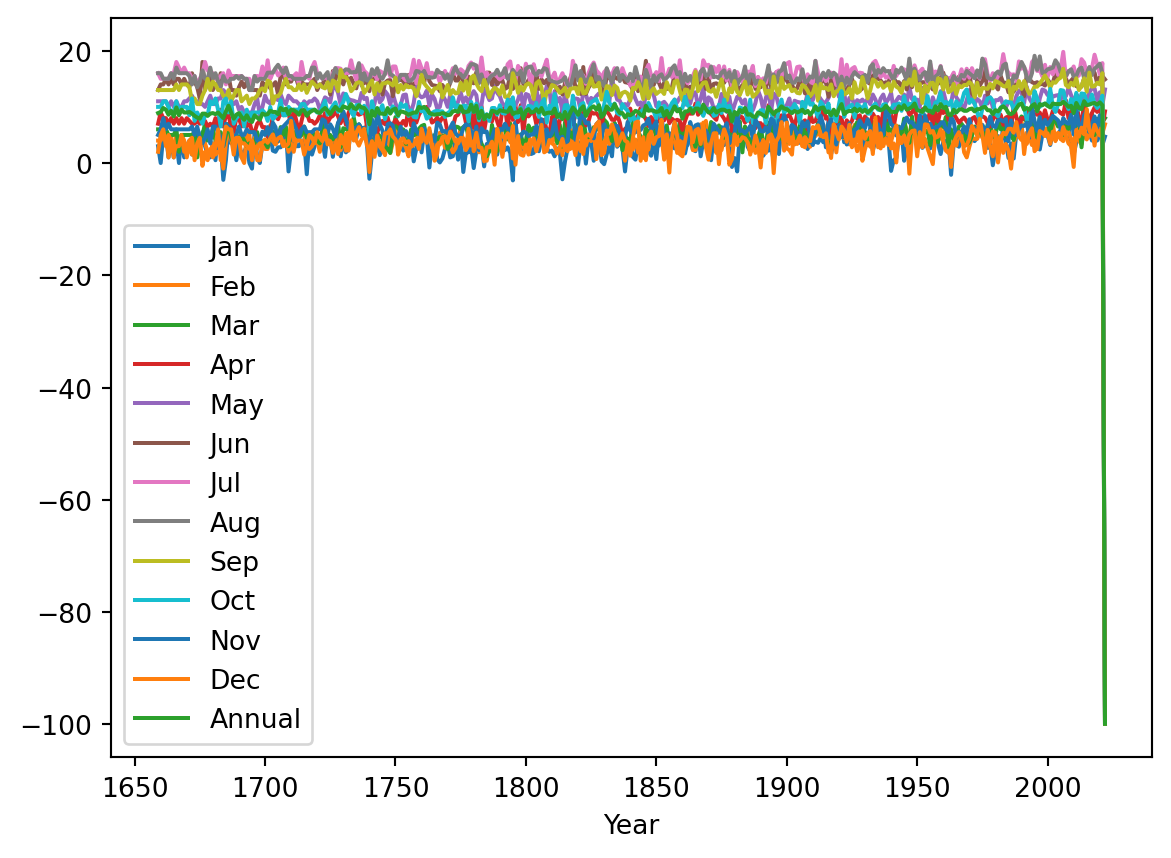
Something is wrong with this. There’s a line on the right-hand side which seems wrong. If we look at the last few lines of the data to see what’s going on:
temperature.tail()| Jan | Feb | Mar | Apr | May | Jun | Jul | Aug | Sep | Oct | Nov | Dec | Annual | |
|---|---|---|---|---|---|---|---|---|---|---|---|---|---|
| Year | |||||||||||||
| 2018 | 5.3 | 3.1 | 5.0 | 9.9 | 13.3 | 16.1 | 19.3 | 16.8 | 13.7 | 10.5 | 8.3 | 6.8 | 10.7 |
| 2019 | 4.0 | 6.9 | 7.9 | 9.1 | 11.2 | 14.2 | 17.6 | 17.2 | 14.3 | 9.8 | 6.2 | 5.7 | 10.4 |
| 2020 | 6.4 | 6.4 | 6.8 | 10.5 | 12.6 | 15.3 | 15.8 | 17.7 | 14.0 | 10.4 | 8.5 | 4.9 | 10.8 |
| 2021 | 3.2 | 5.3 | 7.3 | 6.5 | 10.3 | 15.5 | 17.8 | 16.0 | 16.0 | 12.0 | 7.2 | 6.3 | 10.3 |
| 2022 | 4.7 | 6.9 | 8.0 | 9.2 | 13.1 | 14.9 | -99.9 | -99.9 | -99.9 | -99.9 | -99.9 | -99.9 | -99.9 |
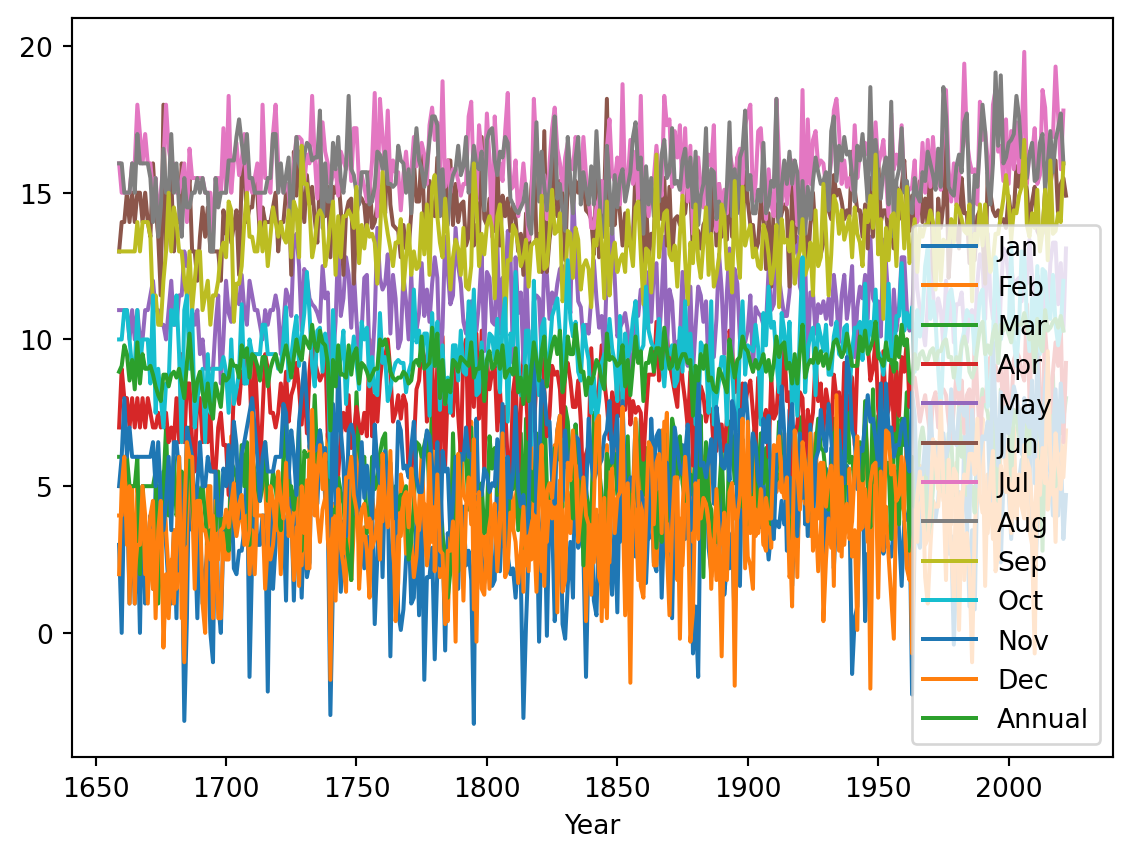
We can see there are some -99.9 in the data, repsenting missing data. We should fix this with na_values:
temperature = pd.read_csv(
    "./data/meantemp_monthly_totals.txt",
    skiprows=4,
    sep=r'\s+',
    index_col="Year",
    na_values=["-99.9"]
)
temperature.tail()| Jan | Feb | Mar | Apr | May | Jun | Jul | Aug | Sep | Oct | Nov | Dec | Annual | |
|---|---|---|---|---|---|---|---|---|---|---|---|---|---|
| Year | |||||||||||||
| 2018 | 5.3 | 3.1 | 5.0 | 9.9 | 13.3 | 16.1 | 19.3 | 16.8 | 13.7 | 10.5 | 8.3 | 6.8 | 10.7 |
| 2019 | 4.0 | 6.9 | 7.9 | 9.1 | 11.2 | 14.2 | 17.6 | 17.2 | 14.3 | 9.8 | 6.2 | 5.7 | 10.4 |
| 2020 | 6.4 | 6.4 | 6.8 | 10.5 | 12.6 | 15.3 | 15.8 | 17.7 | 14.0 | 10.4 | 8.5 | 4.9 | 10.8 |
| 2021 | 3.2 | 5.3 | 7.3 | 6.5 | 10.3 | 15.5 | 17.8 | 16.0 | 16.0 | 12.0 | 7.2 | 6.3 | 10.3 |
| 2022 | 4.7 | 6.9 | 8.0 | 9.2 | 13.1 | 14.9 | NaN | NaN | NaN | NaN | NaN | NaN | NaN |
temperature.plot()