import pandas as pdimport seaborn as sns= pd.read_csv("https://milliams.com/courses/data_analysis_python/titanic.csv" )
0
Abbing, Mr. Anthony
male
42.0
3rd
S
United States
5547.0
7.11
0.0
0.0
no
1
Abbott, Mr. Eugene Joseph
male
13.0
3rd
S
United States
2673.0
20.05
0.0
2.0
no
2
Abbott, Mr. Rossmore Edward
male
16.0
3rd
S
United States
2673.0
20.05
1.0
1.0
no
3
Abbott, Mrs. Rhoda Mary 'Rosa'
female
39.0
3rd
S
England
2673.0
20.05
1.0
1.0
yes
4
Abelseth, Miss. Karen Marie
female
16.0
3rd
S
Norway
348125.0
7.13
0.0
0.0
yes
...
...
...
...
...
...
...
...
...
...
...
...
2202
Wynn, Mr. Walter
male
41.0
deck crew
B
England
NaN
NaN
NaN
NaN
yes
2203
Yearsley, Mr. Harry
male
40.0
victualling crew
S
England
NaN
NaN
NaN
NaN
yes
2204
Young, Mr. Francis James
male
32.0
engineering crew
S
England
NaN
NaN
NaN
NaN
no
2205
Zanetti, Sig. Minio
male
20.0
restaurant staff
S
England
NaN
NaN
NaN
NaN
no
2206
Zarracchi, Sig. L.
male
26.0
restaurant staff
S
England
NaN
NaN
NaN
NaN
no
2207 rows × 11 columns
Summarising
Find the average age of all people on board
Use a filter to select only the males
= titanic[titanic["gender" ] == "male" ]
Find the average age of the males on board
Filtering
Select on the people in 3rd class
"class" ] == "3rd" ]
0
Abbing, Mr. Anthony
male
42.0
3rd
S
United States
5547.0
7.1100
0.0
0.0
no
1
Abbott, Mr. Eugene Joseph
male
13.0
3rd
S
United States
2673.0
20.0500
0.0
2.0
no
2
Abbott, Mr. Rossmore Edward
male
16.0
3rd
S
United States
2673.0
20.0500
1.0
1.0
no
3
Abbott, Mrs. Rhoda Mary 'Rosa'
female
39.0
3rd
S
England
2673.0
20.0500
1.0
1.0
yes
4
Abelseth, Miss. Karen Marie
female
16.0
3rd
S
Norway
348125.0
7.1300
0.0
0.0
yes
...
...
...
...
...
...
...
...
...
...
...
...
1313
Yūsuf, Mrs. Kātrīn
female
23.0
3rd
C
Lebanon
2668.0
22.0702
0.0
2.0
yes
1315
Zakarian, Mr. Mapriededer
male
22.0
3rd
C
Turkey
2656.0
7.0406
0.0
0.0
no
1316
Zakarian, Mr. Ortin
male
27.0
3rd
C
Turkey
2670.0
7.0406
0.0
0.0
no
1317
Zenni, Mr. Philip
male
25.0
3rd
C
Lebanon
2620.0
7.0406
0.0
0.0
yes
1318
Zimmermann, Mr. Leo
male
29.0
3rd
S
Germany
315082.0
7.1706
0.0
0.0
no
709 rows × 11 columns
Select just the passengers
The technique shown in class was to combine together multiple selectors with |:
= titanic["class" ] == "1st" ) | "class" ] == "2nd" ) | "class" ] == "3rd" )
However, it is also possible to use the isin method to select from a list of matching options:
= titanic[titanic["class" ].isin(["1st" , "2nd" , "3rd" ])]
Plotting
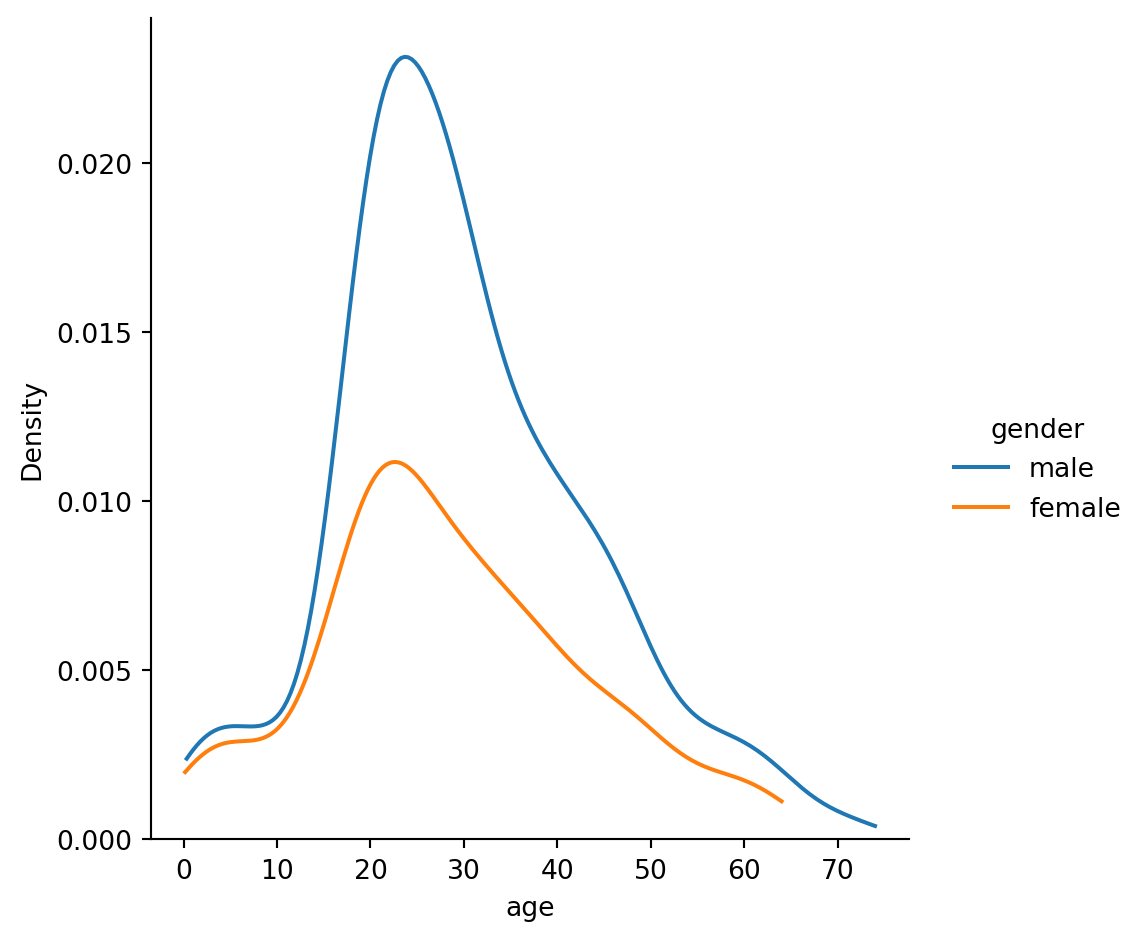
Plot the distribution of ages for males and females
Using displot with age as the main variable shows the distribution. YOu can overlay the two genders using hue="gender". To simplify the view, you can set kind="kde". Since KDE mode smooths the data, you can also set a cutoff of 0 to avoid it showing negative ages:
= passengers,= "age" ,= "gender" ,= "kde" ,= 0
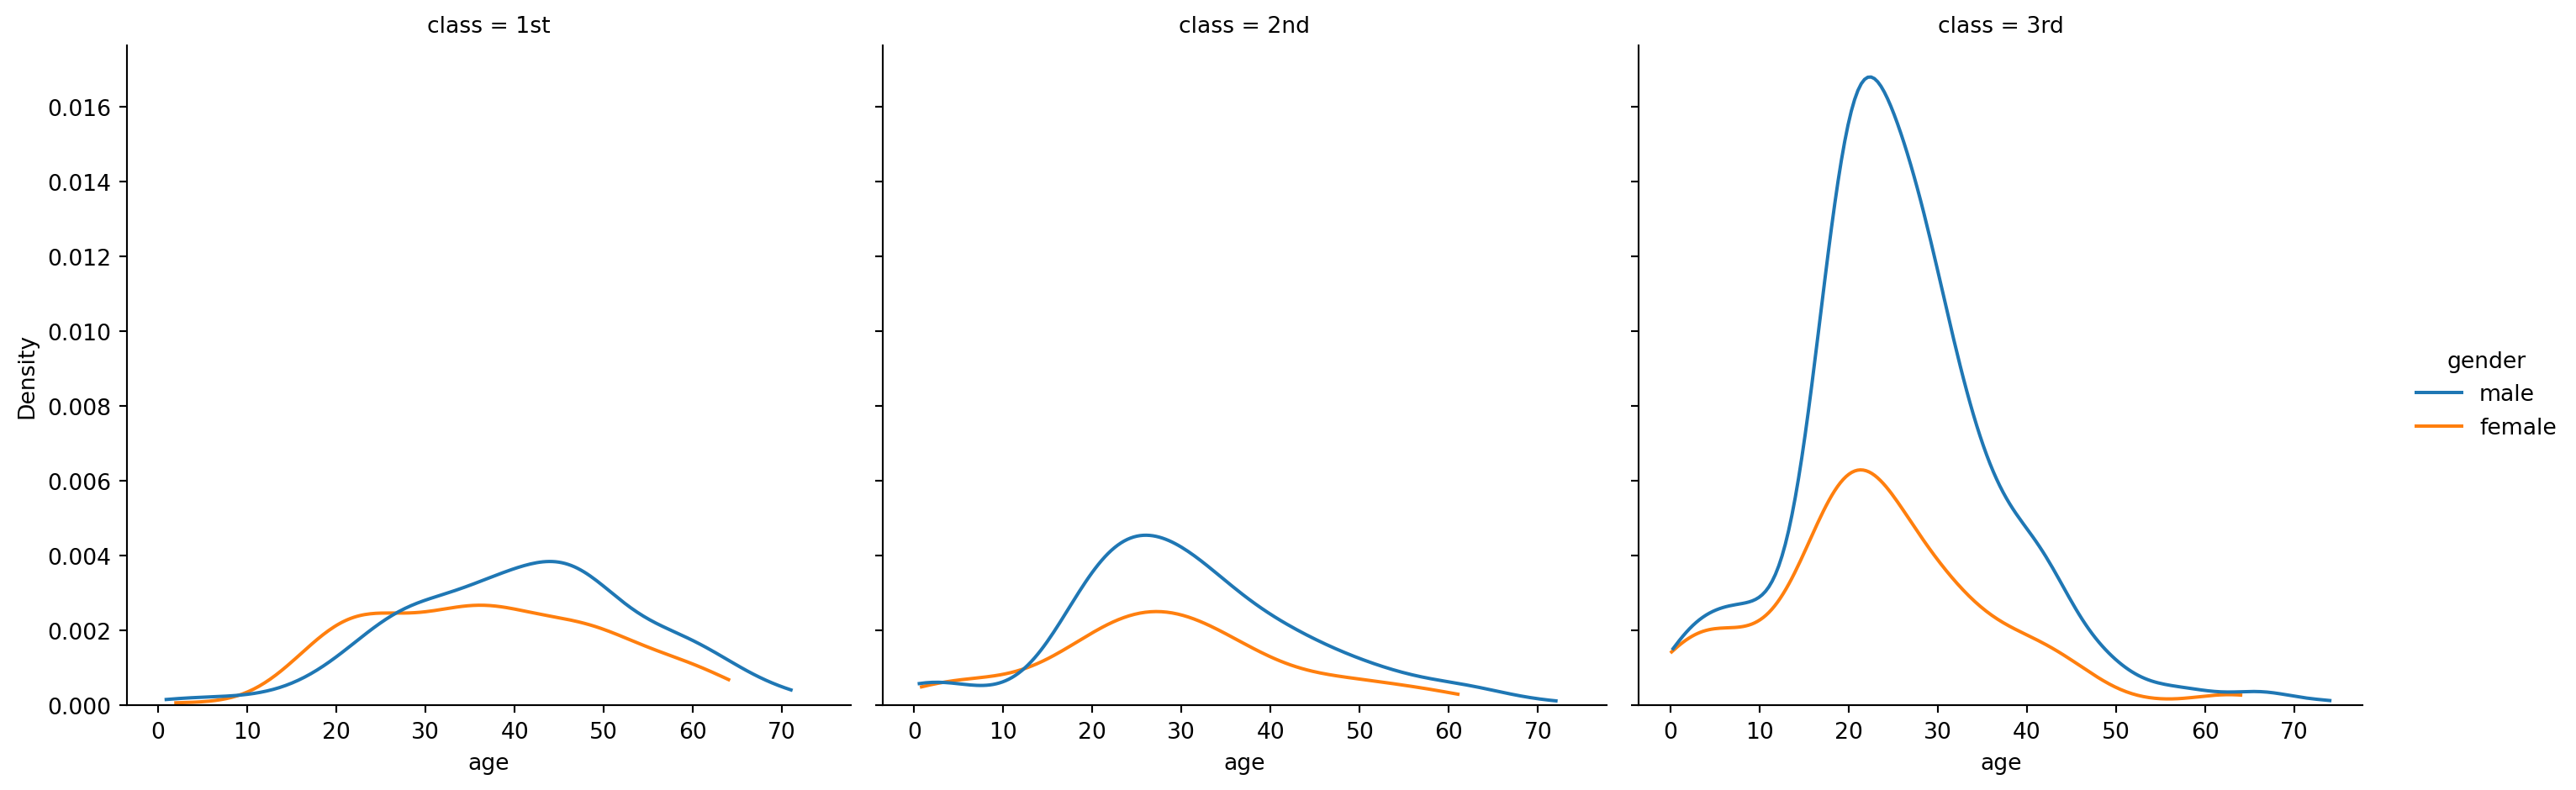
How does this differ by class?
All that has changed from the last plot is adding in the split by class over multiple columns:
= passengers,= "age" ,= "gender" ,= "kde" ,= 0 ,= "class" ,= ["1st" , "2nd" , "3rd" ]
Combining
To reduce the duplication of effort here, I create a function which, given a set of data, calculated the survived fraction within. This is then called three times, once for each class:
def survived_ratio(df):= df[df["survived" ] == "yes" ]return len (yes) / len (df)= survived_ratio(passengers[passengers["class" ] == "1st" ])= survived_ratio(passengers[passengers["class" ] == "2nd" ])= survived_ratio(passengers[passengers["class" ] == "3rd" ])print (ratio_1st, ratio_2nd, ratio_3rd)
0.6203703703703703 0.4154929577464789 0.2552891396332863
Return to course